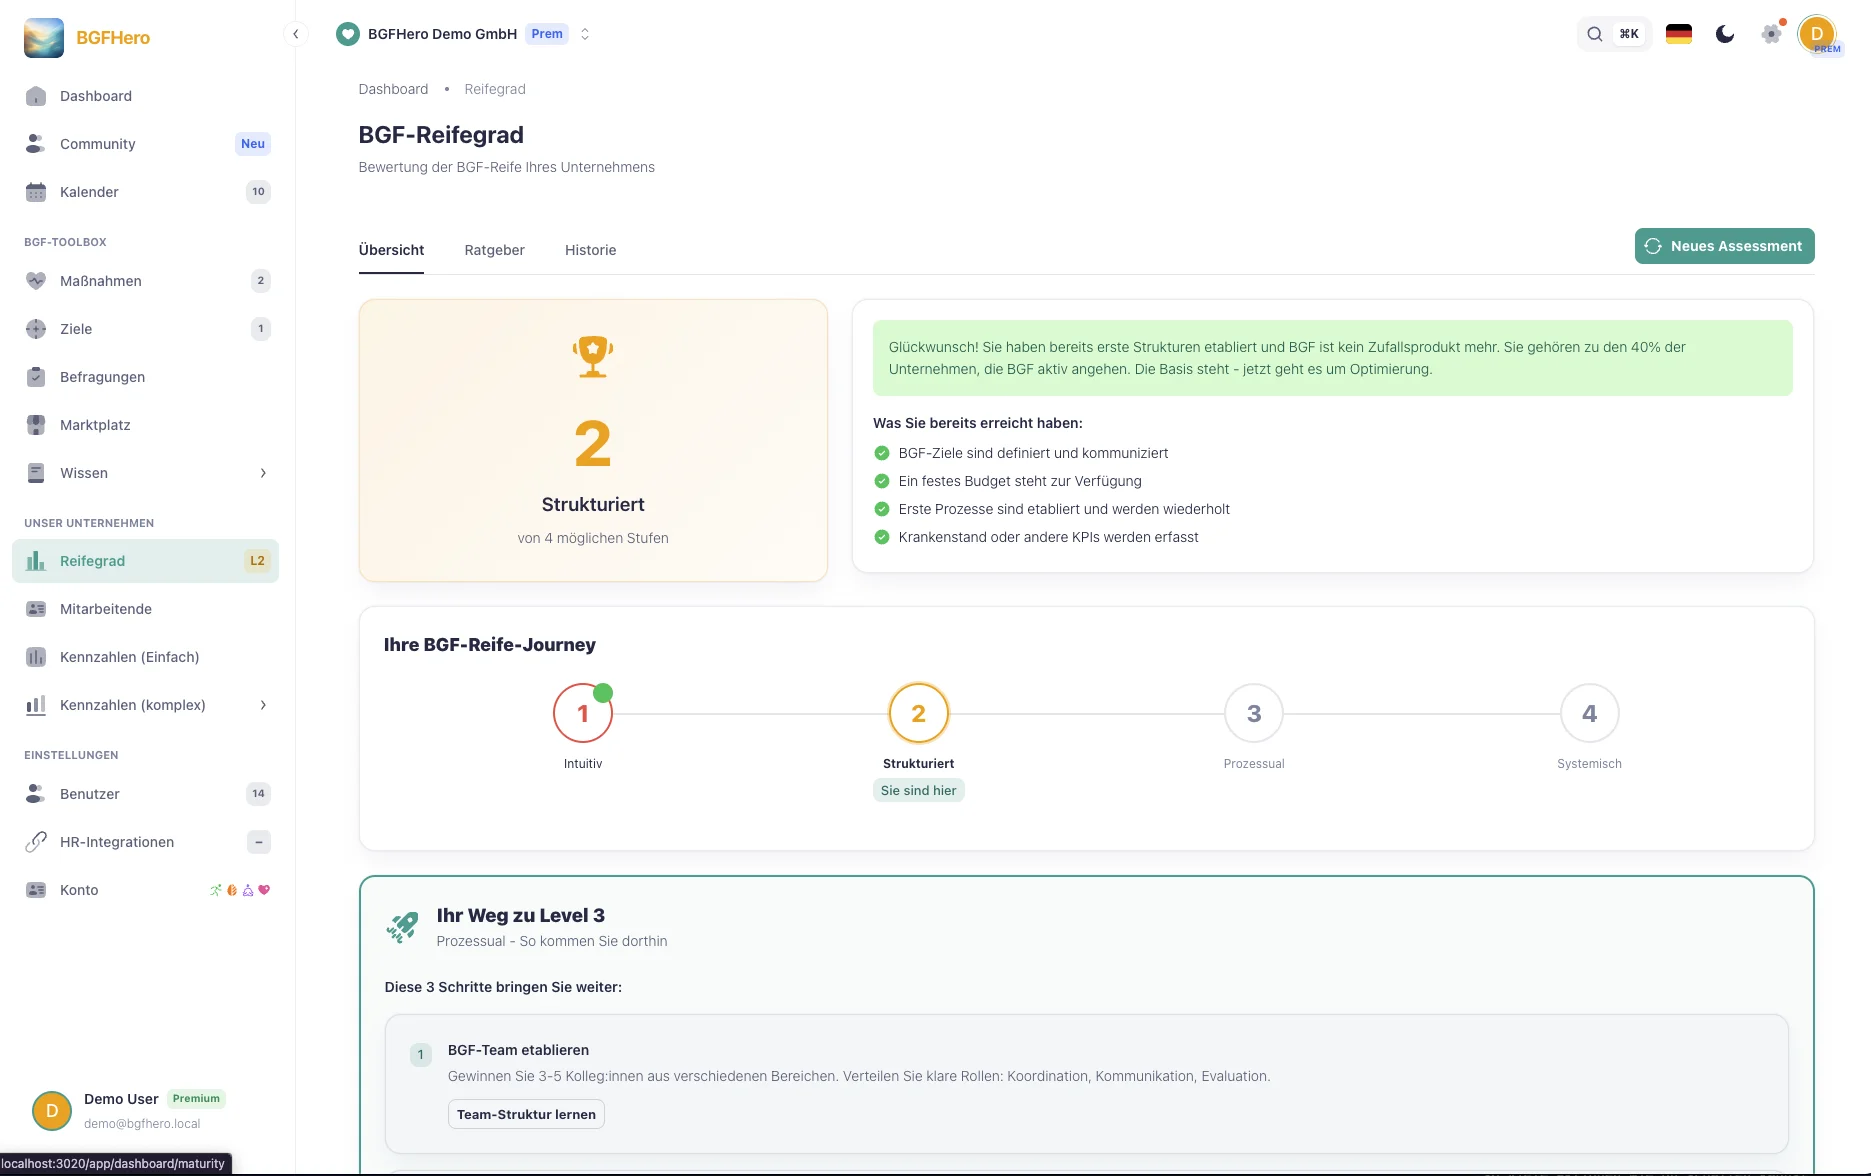
Visualizing WHP maturity: The radar chart as a management tool
What does a WHP maturity level measure — and why is it important?
The GKV Prevention Guideline (version from December 17, 2025) describes workplace health promotion (WHP) not as a single measure, but as a management task: needs analysis, planning, implementation, evaluation — a cycle that must be systematically managed. This is exactly where the WHP maturity level comes in: It does not assess which fruit baskets or yoga classes are available, but how well your workplace health promotion (WHP) functions as a management system.
The maturity level answers three questions: What do we already have? What is still missing? And where should we invest next? Without such an assessment, WHP budgets are often used reactively — depending on the mood or the latest absence report. A structured maturity analysis makes priorities more objective and creates a basis for discussion that goes beyond personal opinions. You can determine where your company stands with the WHP Maturity Check.
How does the radar chart make 10 action areas visible?
A radar chart (also called a spider or web diagram) is particularly well suited for maturity analyses because it shows several dimensions at once and makes gaps immediately visible. In this framework, 10 action areas are assessed:
**Physical activity** — Are there activity programs, stair use campaigns, active breaks? **Nutrition** — Canteen, snack options, nutrition counseling? **Stress & resilience** — Risk assessment for psychological stress, mindfulness programs, management awareness training? **Addiction prevention** — Company agreement, counseling services, clear contact persons? **Ergonomics** — Workplace inspections, height-adjustable desks, screen work safety? **Leadership & health** — Are managers trained? Is there a health-promoting leadership culture? **Corporate culture** — Are health topics actively communicated? Are there role models from management? **Prevention & early intervention** — Occupational health care, vaccination offers, return-to-work interviews? **Governance & management** — WHP officers, steering committee, budget, reporting? **Modern work** — Remote health, hybrid offerings, digital tools?
Each action area is rated on a scale from 1 to 5. Experience shows the first round takes 20–30 minutes if you discuss the questions as a team rather than answering them alone. The resulting chart immediately shows where you are strong and where real gaps exist.
How do you use the maturity level for WHP communication?
A completed radar chart is not an end in itself — it is a communication tool. Especially with management, it enables a factual conversation: Instead of saying "We need more budget for health," you show: "In five out of ten areas, we are below level 3 — here are the three with the greatest leverage."
The tool is especially effective when used for year-on-year comparison. If you do an assessment in December and repeat it a year later, management can see exactly what has changed. Progress becomes visible — even if absence figures do not show a clear improvement in the short term due to fluctuations.
Recommendation: Present the radar chart once a year as part of a WHP steering meeting. In addition to the WHP team, invite the HR manager and ideally a representative of management. Three key questions for this meeting: What has improved since last year? In which action area is the greatest untapped leverage? Which area do we prioritize for the next planning period?
How to put it in place
- 1Start the maturity self-check: Open the "WHP Maturity" section in EasyBGM and start the guided self-check. You rate each of the 10 focus areas on a scale of 1–5 based on concrete criteria — no guessing, just a structured assessment.
- 2Invite the team (optional, but recommended): Invite HR colleagues or managers as co-assessors. EasyBGM averages the assessments and shows where your internal perceptions diverge — this is often the most insightful part.
- 3Generate and review the radar chart: After the self-check, EasyBGM automatically creates your radar chart across all 10 focus areas. Review the result: do the focus points match your gut feeling? Surprises point to blind spots.
- 4Derive and document priorities: Based on the chart, EasyBGM suggests the three focus areas with the greatest catch-up potential. Assign a priority (high/medium/low) and a rough implementation year to each area — this becomes the basis for your next WHP annual planning.
- 5Export the chart and use it for executive reporting: Export the radar chart as PNG or PDF. You can embed it directly in PowerPoint, Google Slides, or your health report. EasyBGM keeps the current assessment saved — on the next run, you'll automatically see the year-over-year comparison.
What you need
- Effort
- under 30 min
- Cost
- Free
- Duration
- 1 hour
- Setup
- 30 min
- ✓ A clear picture of the status quo: after the self-check, you know where your WHP is strong and where real gaps exist — a structured assessment instead of vague feelings.
- ✓ Executive communication on equal footing: the radar chart makes WHP investments visually justifiable — you're not asking for budget, you're showing where the lever is.
- ✓ Progress becomes measurable: in the year-over-year comparison, everyone sees what's actually improved — even when absenteeism fluctuates in the short term.
- ✓ A planning basis instead of gut feeling: priorities for the next WHP period come from data, not from the loudest voice in the room.
Adopt it for your company
One click — and the measure sits ready in your plan. Guided step by step, no lengthy setup.
ÜbernehmenZahlt ein auf
Handlungsfeld
Passender Anlass
Passende Best Practices
Nicht sicher, wo ihr anfangen sollt? Selbstcheck →